Neural network can read tree heights from satellite images
Last year marked the beginning of the UN Decade on Ecosystem Restoration. This initiative is aimed at halting the degradation of ecosystems by 2030, preventing it going forward and, if possible, remedying the damage that has already been done. Delivering on these kinds of projects calls for accurate foundations, such as surveys and maps of the existing vegetation.
In an interview, Ralph Dubayah, the Principal Investigator of NASA’s Global Ecosystem Dynamics Investigation (GEDI) mission, explains: “We simply do not know how tall trees are globally. [...] We need good global maps of where trees are. Because whenever we cut down trees, we release carbon into the atmosphere, and we don’t know how much carbon we are releasing.”
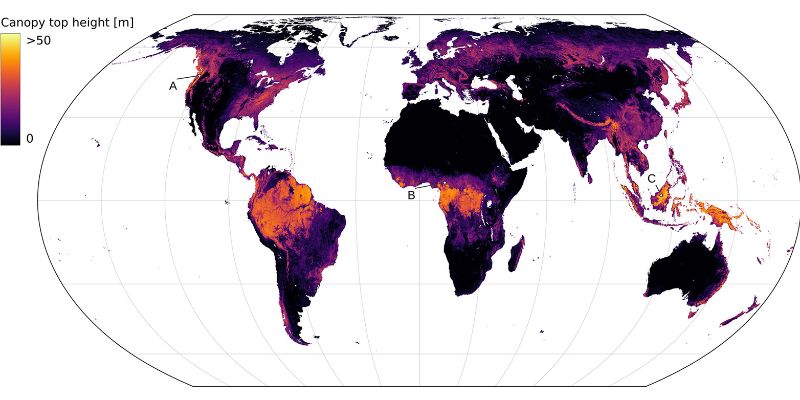
Analysing and preparing precisely this kind of environmental data is what the EcoVision Lab in the ETH Zurich Department of Civil, Environmental and Geomatic Engineering specialises in. Founded by ETH Zurich Professor Konrad Schindler and University of Zurich Professor Jan Dirk Wegner in 2017, this lab is where researchers are developing machine learning algorithms that enable automatic analysis of large-scale environmental data. One of those researchers is Nico Lang. In his doctoral thesis, he developed an approach – based on neural networks – for deriving vegetation height from optical satellite images. Using this approach, he was able to create the first vegetation height map that covers the entire Earth: the Global Canopy Height Map.
The map’s high resolution is another first: thanks to Lang’s work, users can zoom in to as little as 10x10 metres of any piece of woodland on Earth and check the tree height. A forest survey of this kind could lead the way forward particularly in dealing with carbon emissions, as tree height is a key indicator of biomass and the amount of carbon stored. “Around 95 percent of the biomass in forests is made up of wood, not leaves. Thus, biomass strongly correlates with height,” explains Konrad Schindler, Professor of Photogrammetry and Remote Sensing.
Trained with laser scanning data from space
But how does a computer read tree height from a satellite image? “Since we don’t know which patterns the computer needs to look out for to estimate height, we let it learn the best image filters itself,” Lang says. He shows his neural network millions of examples – courtesy of the images from the two Copernicus Sentinel-2 satellites operated by the European Space Agency (ESA). These satellites capture every location on Earth every five days with a resolution of 10x10 metres per pixel. They are the highest-quality images currently available to the public.
The algorithm must also have access to the correct answer – that is, the tree height derived from space laser measurements from NASA’s GEDI mission. “The GEDI mission delivers globally distributed, sparse data on the vegetation height between the latitudes of 51 degrees north and south, so the computer sees many different vegetation types in the training process,” Lang explains. With the input and answer, the algorithm can acquire the filters for textural and spectral patterns itself. Once the neural network has been trained, it can automatically estimate the vegetation height from the more than 250,000 images (some 160 terabytes of data) needed for the global map.
In specialist jargon, Lang’s neural network is known as a convolutional neural network (CNN). The “convolution” is a mathematical operation in which the algorithm slides a 3x3 pixel filter mask over the satellite image to obtain information on brightness patterns in the image. “The trick here is that we stack the image filters. This gives the algorithm contextual information, since every pixel, from the previous convolution layer, already includes information about its neighbours,” Schindler says. As a result, the EcoVision Lab was the first to successfully use satellite maps to also reliably estimate tree heights of up to 55 metres.
Because their many layers make these neural networks “deep”, this method is also called “deep learning”. It heralded a major revolution in image processing around ten years ago. However, dealing with the sheer amount of data remains very challenging: calculating the global vegetation height map would take a single powerful computer three years. “Fortunately, we have access to the ETH Zurich high-performance computing cluster, so we didn’t have to wait three years for the map to be calculated,” Lang says with a laugh.
Transparency by estimating uncertainties
Lang didn’t prepare just one CNN for this task, but several. This is known as an ensemble. “An important aspect for us was also letting users know the uncertainty of the estimate,” he says. The neural networks – five altogether – were trained independently of each other, with each one returning its own estimate of tree height. “If all the models agree, then the answer is clear based on the training data. If the models arrive at different answers, it means there is a higher uncertainty in the estimate,” Lang explains. The models also incorporate uncertainties in the data itself: if a satellite image is hazy, for instance, the uncertainty is greater than when atmospheric conditions are good.
Foundation for future ecological research
Thanks to its high resolution, Lang’s global map provides detailed insights: “We have already discovered interesting patterns,” Schindler says. “In the Rocky Mountains, for example, forests are managed in fixed sections, and the rainforest also forms interesting structures that can’t be coincidental.” Now ecologists can interpret these captured patterns and data globally.
rainforest deforestation.»
To allow this research to continue, the map and its source code will be made publicly accessible (see link). The first interested parties have already been in touch: Walter Jetz, a professor at Yale University, wants to use the Global Canopy Height Map for biodiversity modelling. However, the map could also be of interest to governments, administrative bodies and NGOs. “Thanks to Sentinel-2, vegetation height can be recalculated every five days, making it possible to monitor rainforest deforestation,” Lang says.
In addition, he adds, it is now also possible to globally validate regional findings, such as the way tropical leaf canopies act as a climate buffer. Coupled with the High Carbon Stock Approach, which classifies forests according to their carbon storage and biodiversity value, the vegetation height map is an important foundation for maintaining and strengthening ecosystems. According to Lang’s calculations, vegetation with a height of more than 30 metres is found on only 5 percent of the landmass, and only 34 percent of it is located in protected areas.
With the GEDI mission set to end in 2023, Lang’s newly developed approach offers the possibility to continue mapping vegetation height in future. However, getting the GEDI mission extended – something that is currently also being discussed in the media internationally – is key to comparing its data with future satellite missions such as the ESA Biomass mission and calibrating the model for changes.
