Using satellite imagery to optimise urban cooling
Quantifying the Cooling Establishment Time
In this context, “CET” stands not for Central European Time, but for Cooling Establishment Time, i.e. the time needed for a particular BGI to deliver a stable cooling performance. This topic has been little studied to date. Now, for the first time, a group of Eawag researchers has used satellite data to investigate the CET of various kinds of blue-green infrastructure. In six case studies, the scientists quantified the effects of BGIs constructed in Zurich from 2002 onwards – ranging from trees planted at Tessinerplatz (Zurich Enge railway station) to a steel structure with climbing plants and a pool in the public MFO-Park (Oerlikon district). The CET was calculated on the basis of changes in land surface temperature and in a vegetation health index – both derivable from satellite data.
More rapid impact with irrigation and grasses
According to the open access study published in Sustainable Cities and Society, it took a relatively long time – seven to ten years – for BGIs comprising trees or climbing plants to produce a notable shift in surface temperatures. In contrast, grassy areas or irrigated systems have a measurable impact within one to three years. However, the actual temperature reduction performance depends on numerous other factors. At the six sites investigated, reductions in surface temperatures relative to surrounding areas ranged from 0.5 to over 3 degrees Celsius.
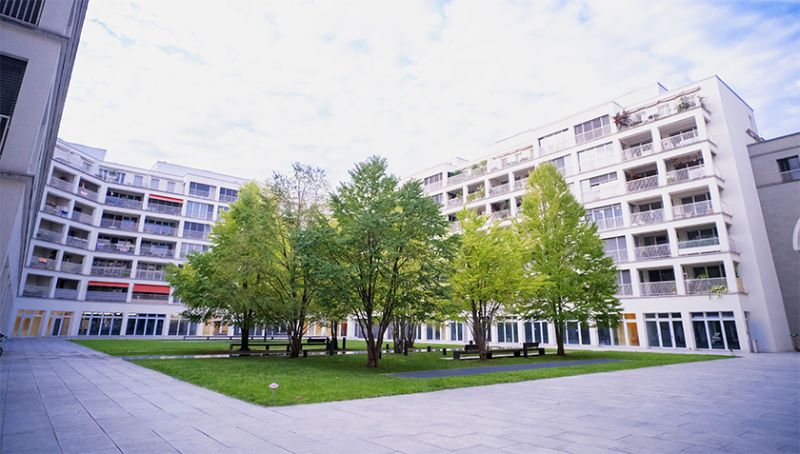
This study forms part of the doctoral research being conducted by architect and civil engineer Lucas Gobatti. His personal favourite is a BGI project carried out at an industrial site on Heinrichstrasse: here, since hot factory roofs were replaced by a courtyard with greenery in 2005, satellite data indicates that surface temperatures are reduced by up to 3.5°C (photo on top). As Gobatti explains, this is due not only to shading but in particular to the irrigation system: “By collecting the water during heavy rainfall and using it subsequently for irrigation, we can massively improve the benefits of blue-green infrastructures.”
Supporting urban greenery planning
As Gobatti emphasises, the aim of the study was not to produce a ranking of BGIs for urban cooling: “We wanted to develop a method, using satellite data, to help us understand what processes are influenced by what measures in the area of blue-green infrastructure.” This should provide a basis for optimising the planning and implementation of BGIs, so that they produce measurable results in a timely manner. The method now needs to be further refined. For example, the cooling effect of trees is currently underestimated, as the satellite measures surface temperatures on top of the canopy, rather than in the shaded area underneath. Gobatti’s supervisor, environmental engineer João Leitão, adds that the selection of BGIs will depend on the specific goals and the number of people experiencing heat vulnerability. It is important to consider all the assets of BGIs – not just a potential temperature reduction but also, for example, slower stormwater run-off or benefits in terms of biodiversity and recreational quality.Taking advantage of Nasa’s online platform ARSET
ARSET (Applied Remote Sensing Training Program) is an online platform offered by the US space agency Nasa, which enables anyone to learn how to use satellite data. Civil engineer and architect Lucas Gobatti, first author of the study described in the main article, says: “Without this training, we could never have done such a good job.” Gobatti had first taken an ARSET course on how satellite data can be analysed for the identification of urban heat islands and the quantification of key parameters. For the study now published, the team were also in touch with a programmer who developed scripts for Google Earth and supported the scientists in developing their own calculations on this basis. More information on Nasa’s training programme
