Tracing mine accidents with satellite data
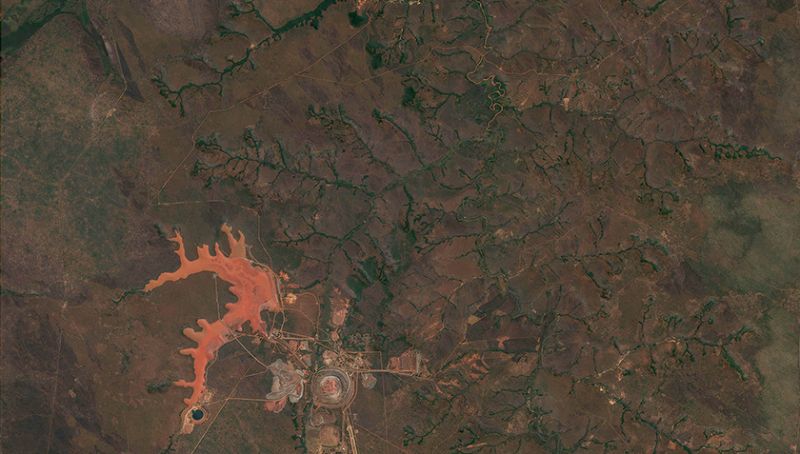
The Catoca mine in northern Angola is one of the largest diamond mines in the world. At the end of July 2021, a serious incident occurred here. Mine tailings, which are produced when the diamonds are extracted from the rock, escaped into the environment from a sedimentation basin. The nearby Tshikapa River transported the metal-laden material hundreds of kilometres further north into the Democratic Republic of Congo. There were soon reports of a strong colouration of the water and tonnes of dead fish. Thousands of people in the neighbouring communities suffered from bouts of diarrhoea, and around a dozen died as a consequence. The Congolese government reported elevated iron and nickel concentrations in the water. Weeks later, the operating company of the Catoca mine admitted that there was a pipe burst, but claimed that it was only a harmless mixture of sand, clay and water that leaked out, and that the composition was comparable to the sediment load carried by the water bodies during the rainy season.
“Unfortunately, such statements are common,” Désirée Ruppen notes, who has been intensively studying the environmental impacts of mining as part of her doctorate at the ETH Zurich and the aquatic research institute Eawag. Even if the excuses are dubious, it is difficult to refute them. “There is no systematic monitoring of water quality in this region, as in many other mining areas in the countries of the Global South,” says Ruppen. Pollution is only detected late, when the consequences are already devastating. If there is a lack of water samples, it is almost impossible to determine the origin and extent of the pollution retrospectively. This is all the more so when it involves large-scale processes in areas that are difficult to access, whether for logistical or political reasons. “In such cases, satellite data is enormously helpful because it allows us to look into the past, so to speak, and reconstruct events from afar, even on a large scale.” That is exactly what Ruppen has done.
Pollution detected over 1400 kilometres
The researcher looked at nine publicly available images of the affected area, taken by Sentinel-2, a pair of satellites of the European Space Agency, whose data can sometimes be particularly suitable for investigating bodies of water. One image pre-dates the event, when the river was still “blue”. The rest were recorded afterwards, between 25 July and 30 August, and already showed the strong colouration of the water. The aim was to identify in this sequence of images where and when the turbidity – caused by particles in the water – had set in, how it spread over time in the further course of the river and how high it was compared to before. James Runnalls, programmer at Eawag, and Daniel Odermatt, head of the Remote Sensing Division at Eawag, assisted Désirée Ruppen in analysing the satellite data. “With the naked eye, you can see where the water is blue and where it is red,” says the geologist, Désirée Ruppen, “but in order to determine the extent, the intensity of the turbidity and thus the degree of pollution, you need the computer.” By combining different methods and algorithms, it was possible for the researchers to develop an automated analysis process for optical satellite data that makes it possible for the first time to observe and quantify the pollution of an entire river system.
“We were able to trace how the pollution spread over about 1400 kilometres in the river system within five weeks,” says Ruppen. “This allowed us to determine the flow rate of the water and subsequently the time of the accident: the spill began at noon on 24 July.” It is not possible to determine from satellite data which pollutants occurred and in what concentrations; this would have required on-site water samples. But the researchers were able to calculate that the turbidity of the water, i.e. the particle load, was several orders of magnitude higher than before the event. As the comparison with 170 older satellite images since 2015 showed, the turbidity in the Tshikapa River had never been as high as in the days after the accident. The claim of the operating company that the river was no more polluted than during the rainy season was thus refuted. Ruppen: “The data shows that the contamination of the water far exceeded drinking water standards, which almost certainly led to massive deaths of fish and human casualties as well.”
Clouds obstruct view
Have Ruppen and her colleagues found the universal formula for solving cases of mining accidents? “It’s not that simple,” says the geologist, who has evaluated the transferability of her method to a number of comparable events. The main problem is the availability of satellite data. Sentinel-2 was initially launched in 2015 with only one satellite, which flew over a given location every ten days. With the launch of the second Sentinel-2 satellite, the duration between two fly-overs was reduced to five days. Nevertheless, it is possible for there to be no satellite data or no usable data for the critical period of an event. After all, if clouds obstruct the view of the affected waters, these cannot be analysed in the images. This is all the more problematic because many mines in the countries of the Global South are located in the tropics, where the seasonal rains are accompanied not only by heavy cloud, but also by an increased risk of mine accidents due to the heavy rainfall. “Of more than two dozen events since 2015, I have only identified four more for which cloud-free satellite data is available and which could be reconstructed with our method,” says Désirée Ruppen. However, a lot is happening in the field of remote sensing; the Sentinel-2 mission will continue in the long term at a high frequency, and new satellites are being developed that can also map water surfaces using radar. The possible applications of Ruppen’s method for future mine disasters thus remain and can be expanded by new technologies.
